Bears are not going to give us so easily, according to the CoinMarketCap ranking.
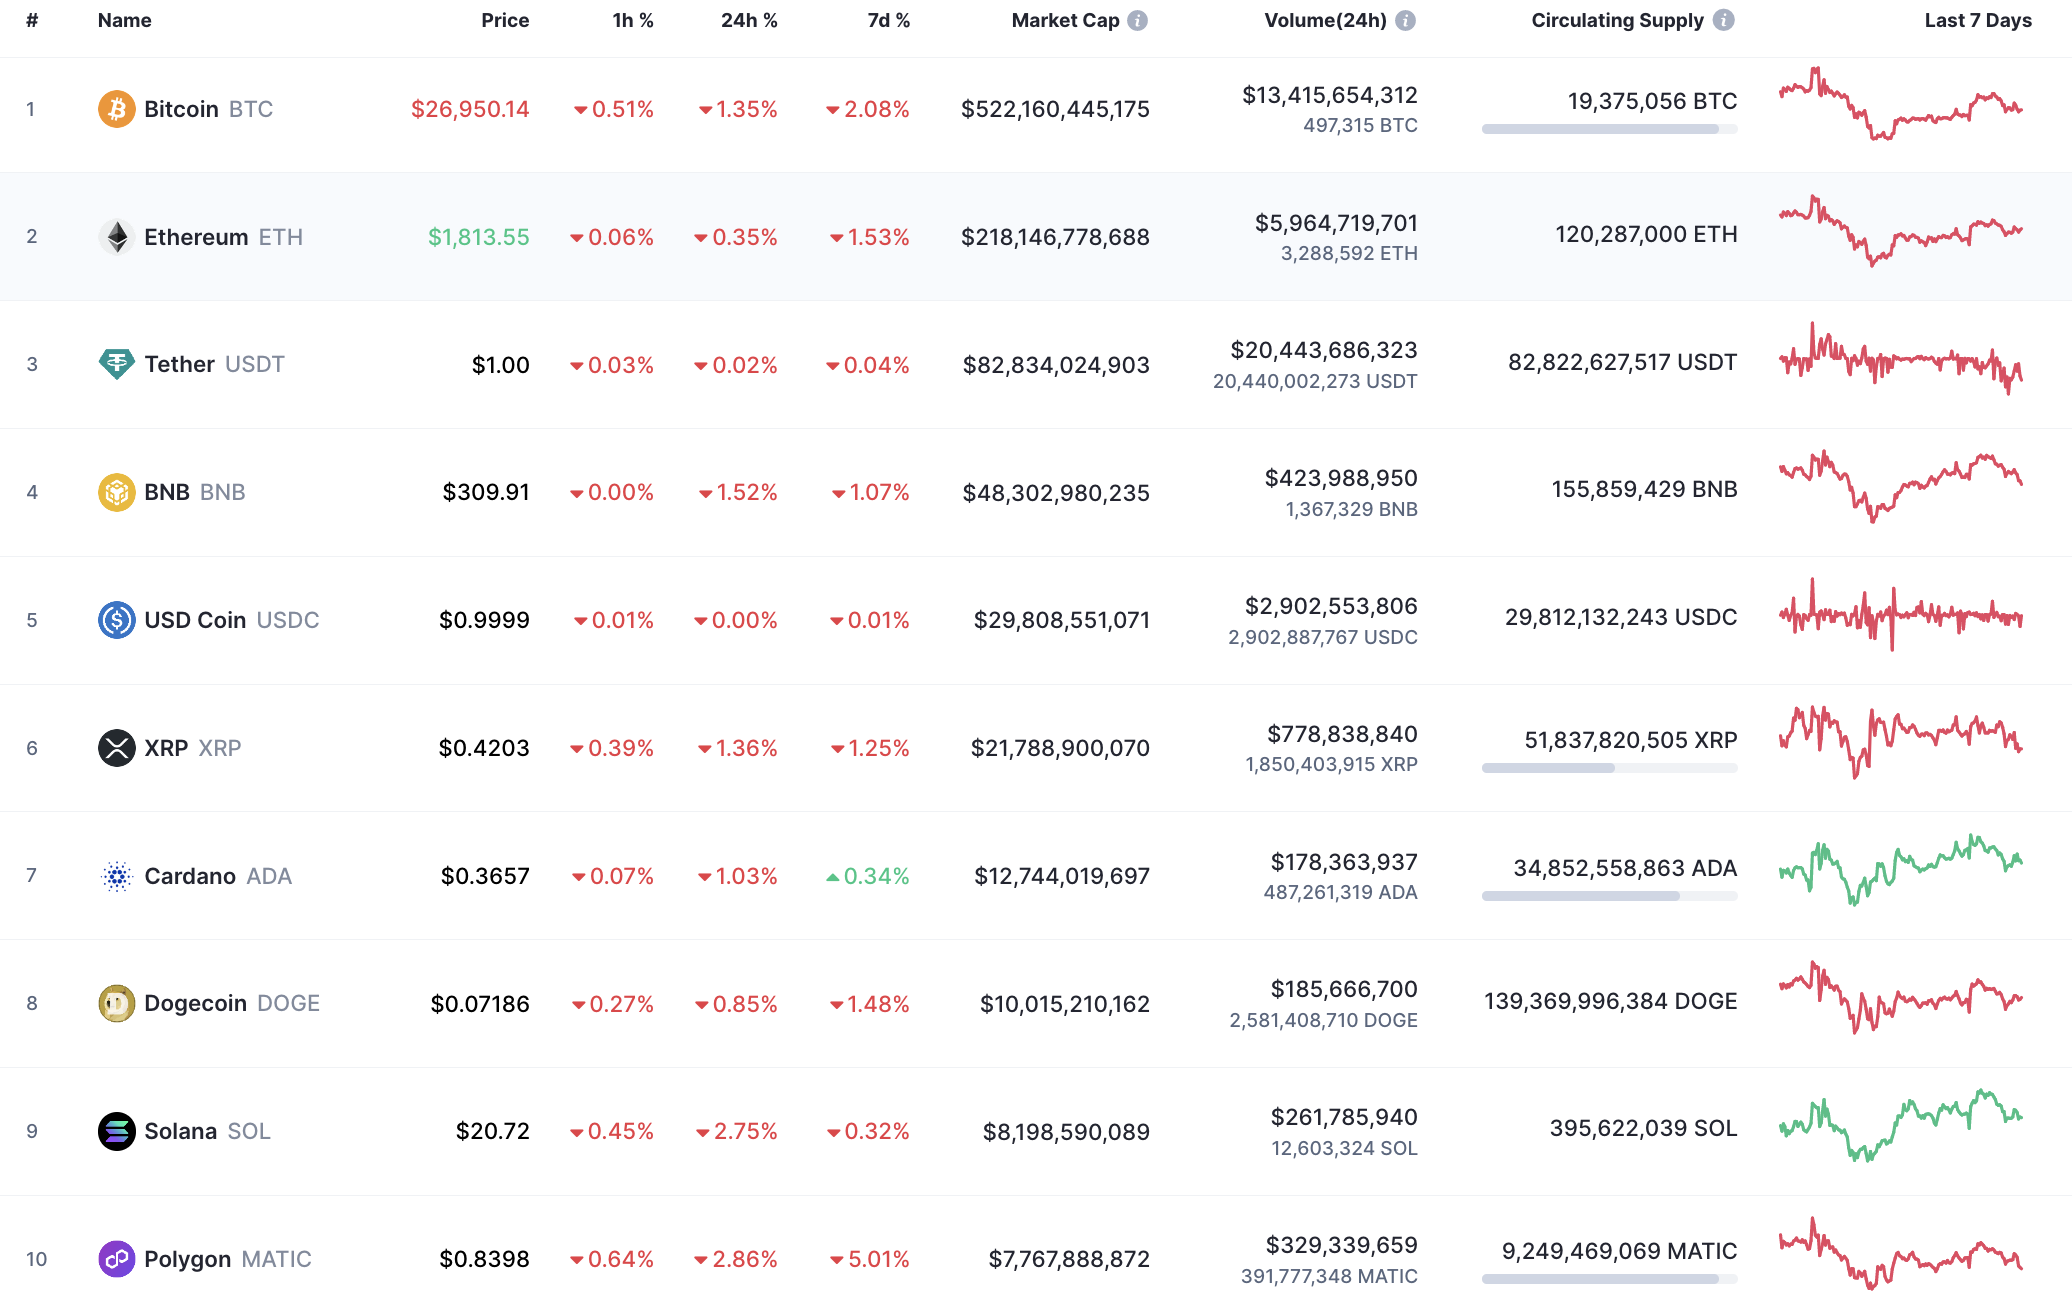
Top coins by CoinMarketCap
SHIB/USD
The rate of SHIB has declined by 0.88% since yesterday.
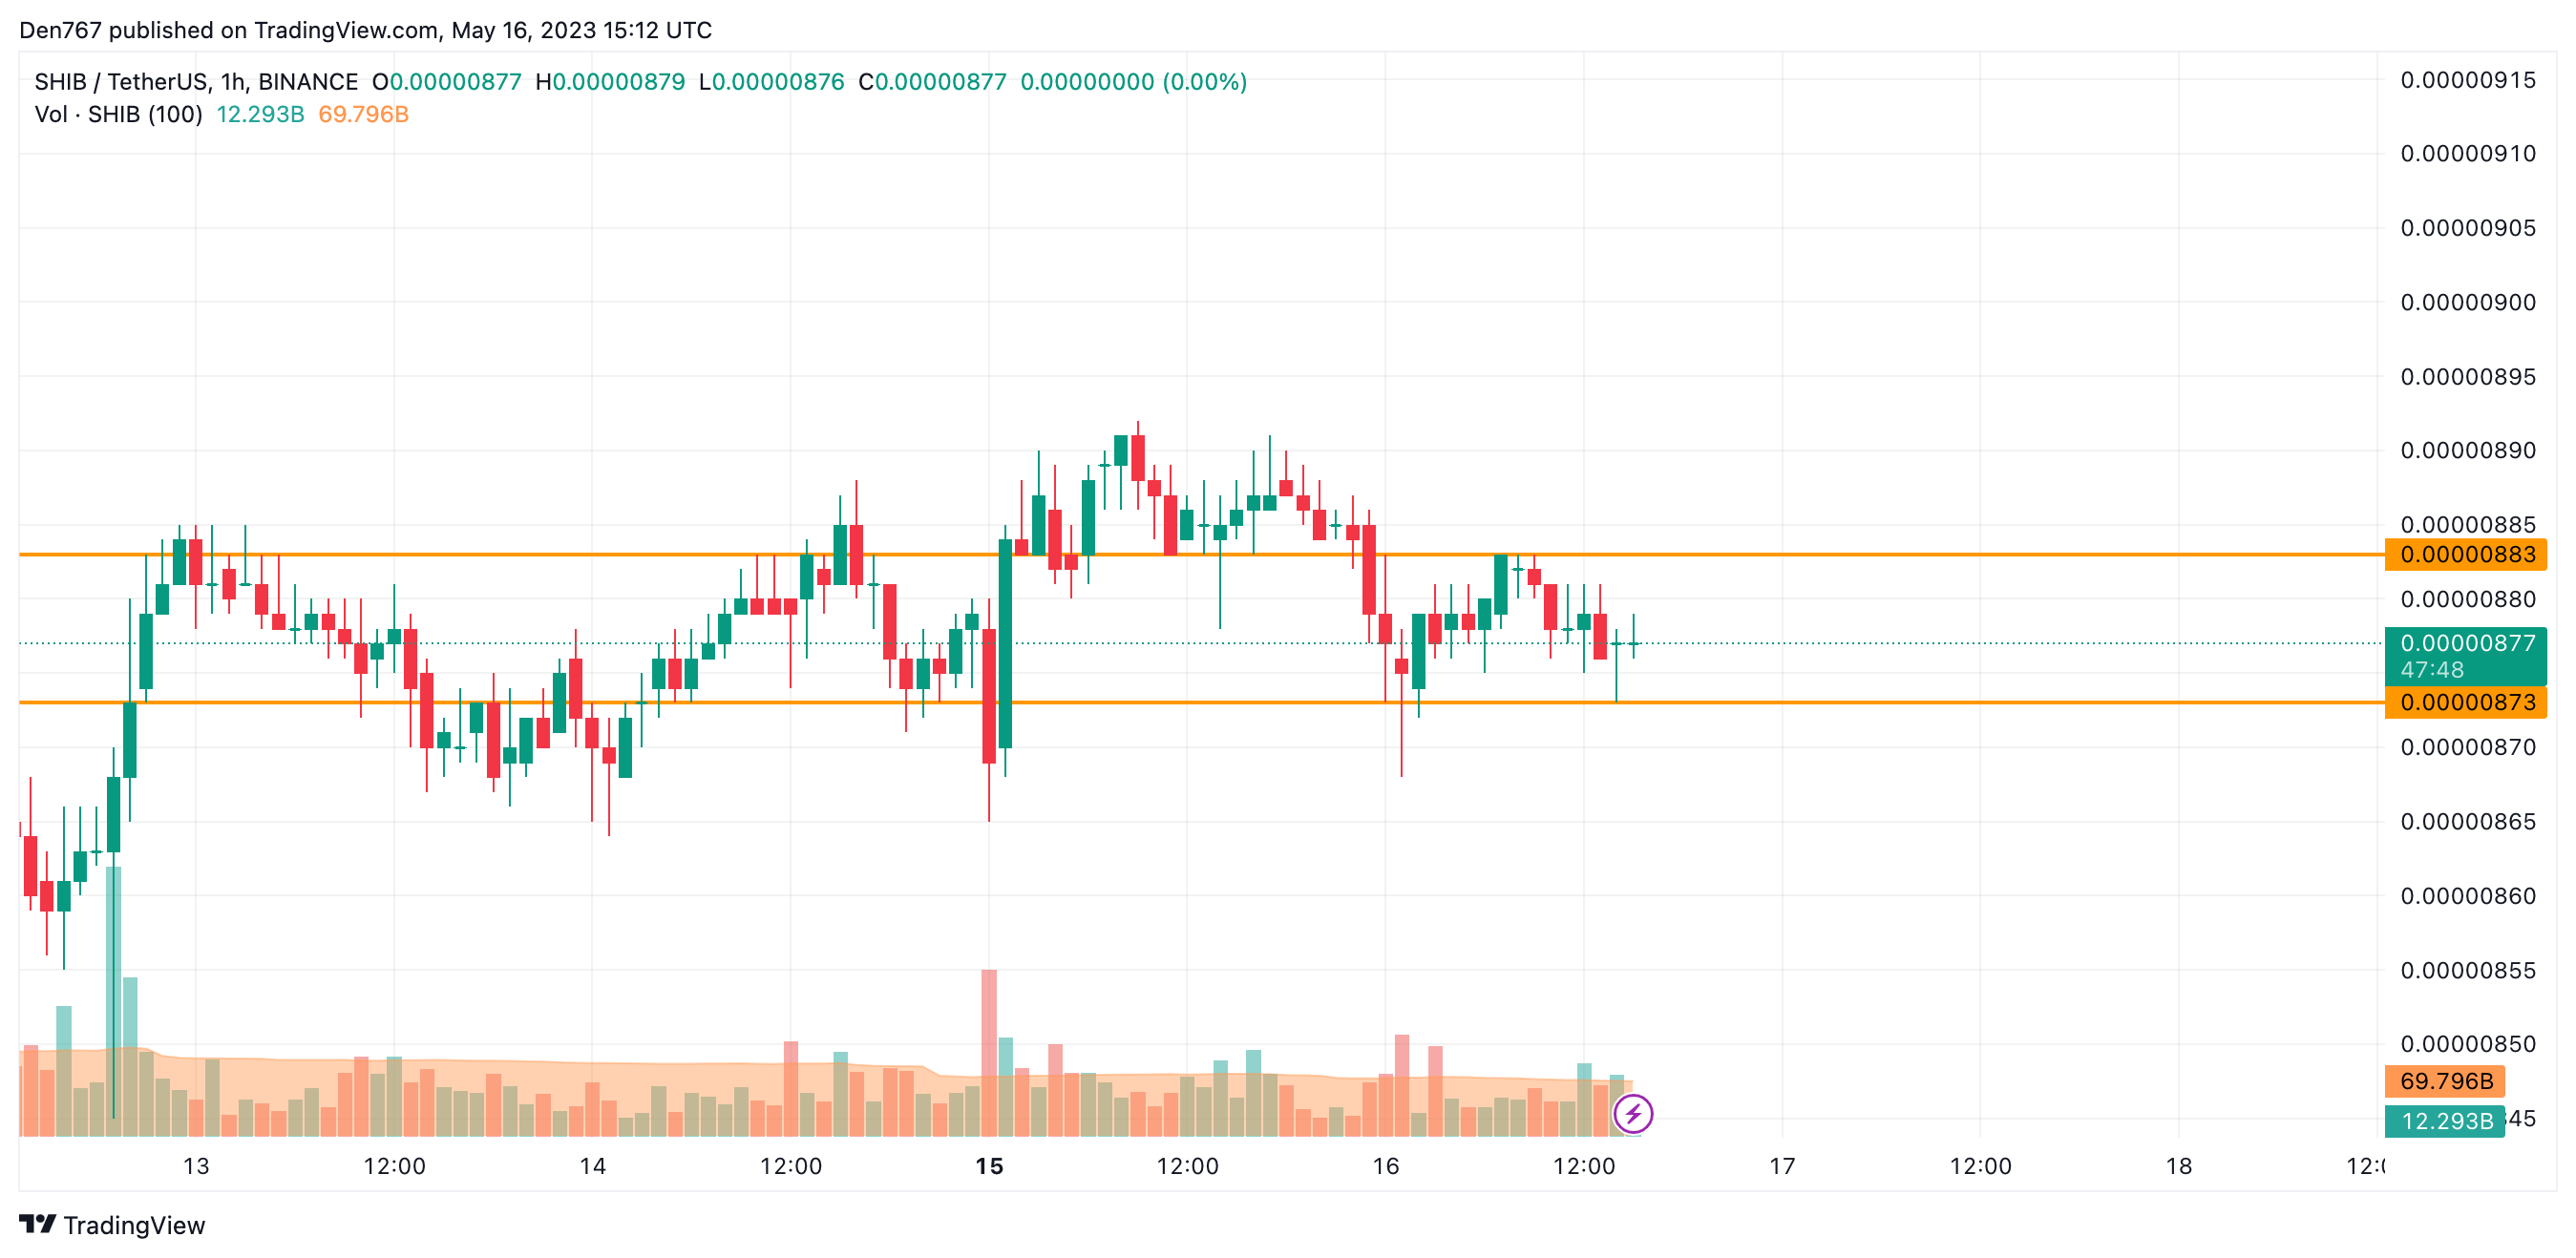
Image by TradingView
On the local chart, the price of SHIB is trading within a narrow range, accumulating strength for a further move. At the moment, the situation is more bearish than bullish as the rate keeps falling after a test of the resistance at $0.00000883.
All in all, traders can expect an ongoing drop below the support at $0.00000873 soon.
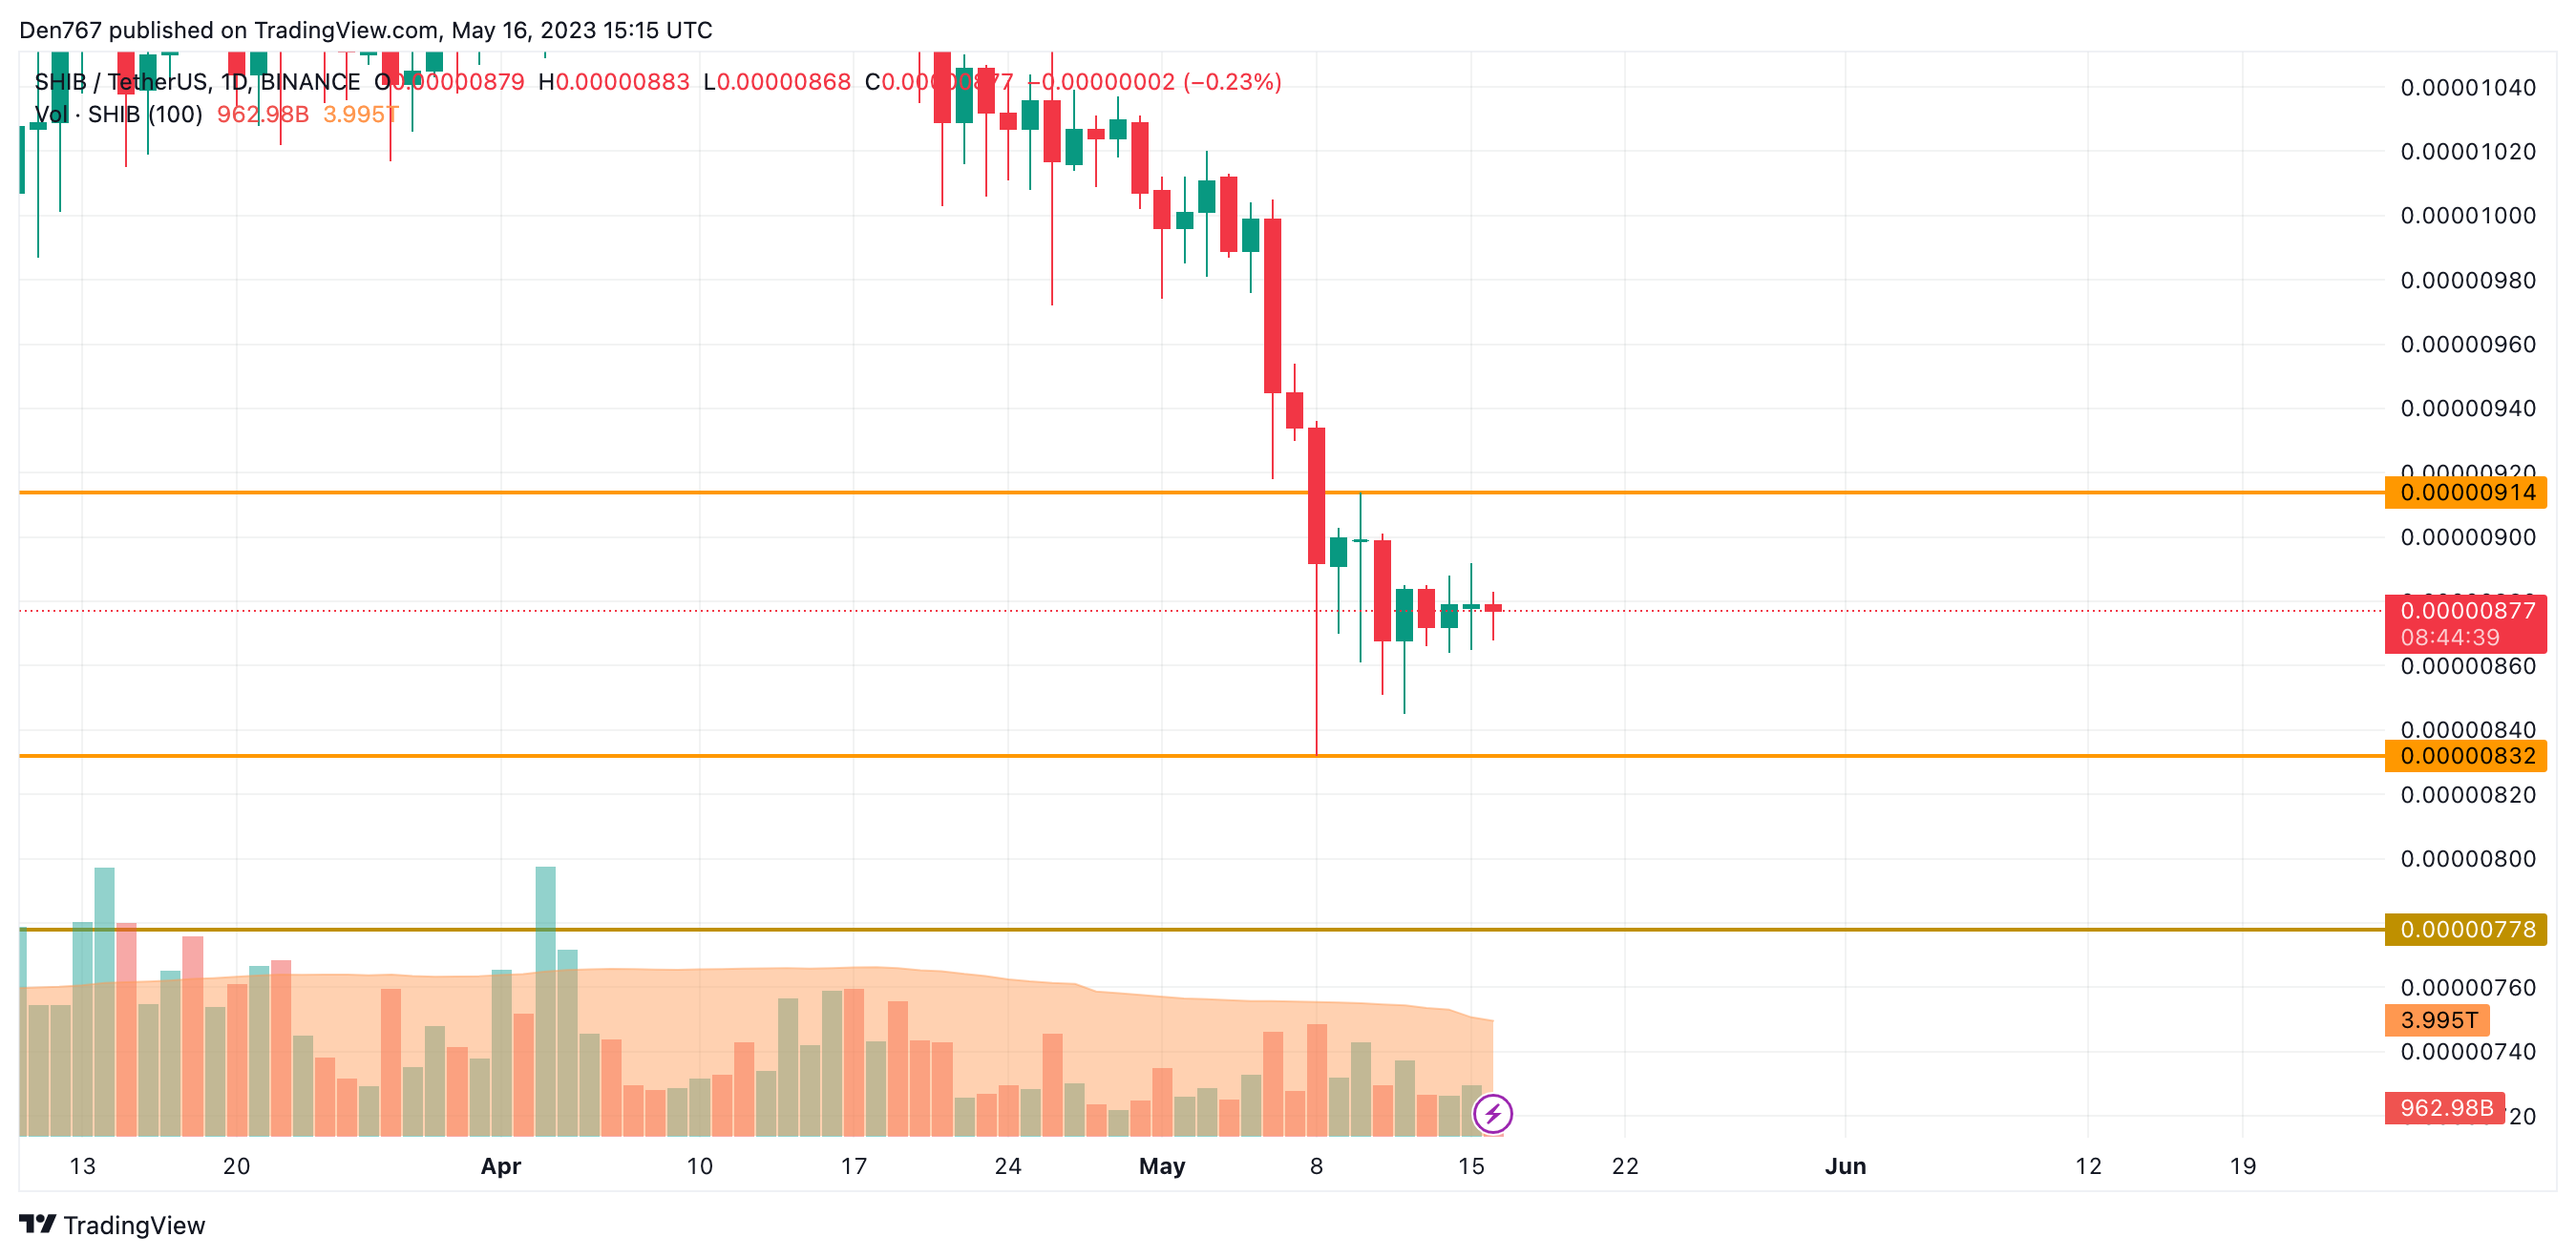
Image by TradingView
On the bigger chart, the situation is unchanged since yesterday. None of the sides is ready to seize the initiative from the technical point of view. In addition, the volume keeps going down. Respectively, ongoing sideways trading remains the more likely scenario for the next few days.
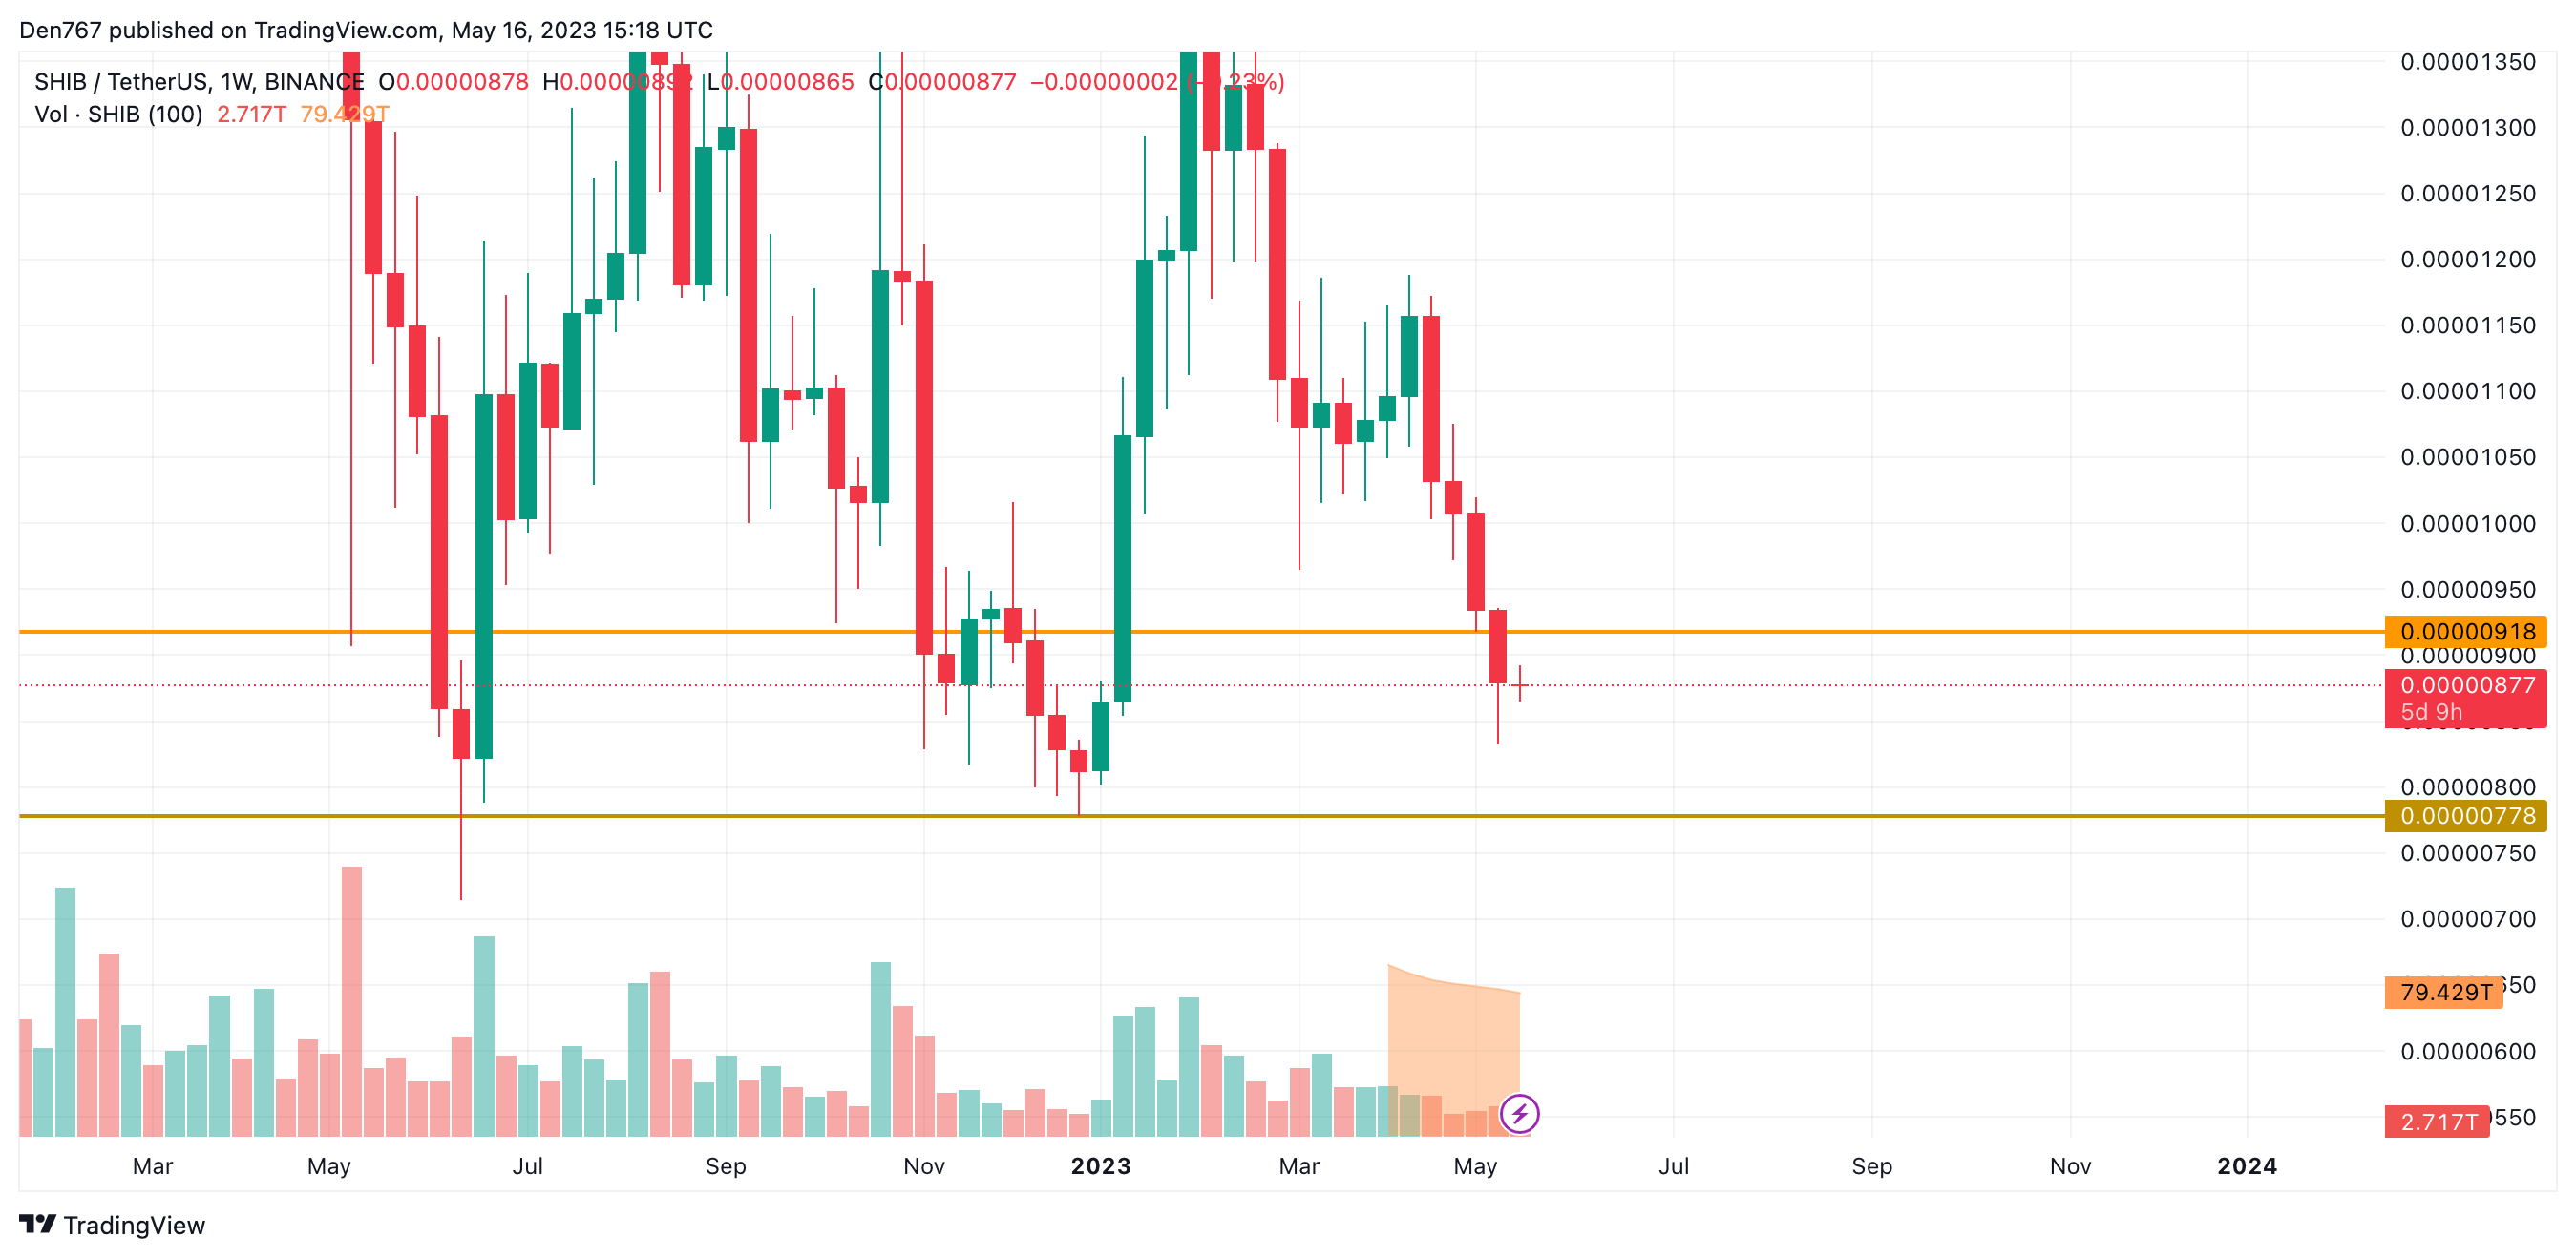
Image by TradingView
On the weekly time frame, it is too early to make any predictions as the price is far from the key levels. However, if buyers want to get back in the game, they need to restore the price above the resistance at $0.00000918.
SHIB is trading at $0.00000877 at press time.