The Ripple XRP price has decreased since July. It broke down from the $0.53 area in August.
Despite this breakdown, the price has regained its footing and is attempting to reclaim the $0.53 area. Will it be successful?
Ripple Breaks Out From Resistance Trendline
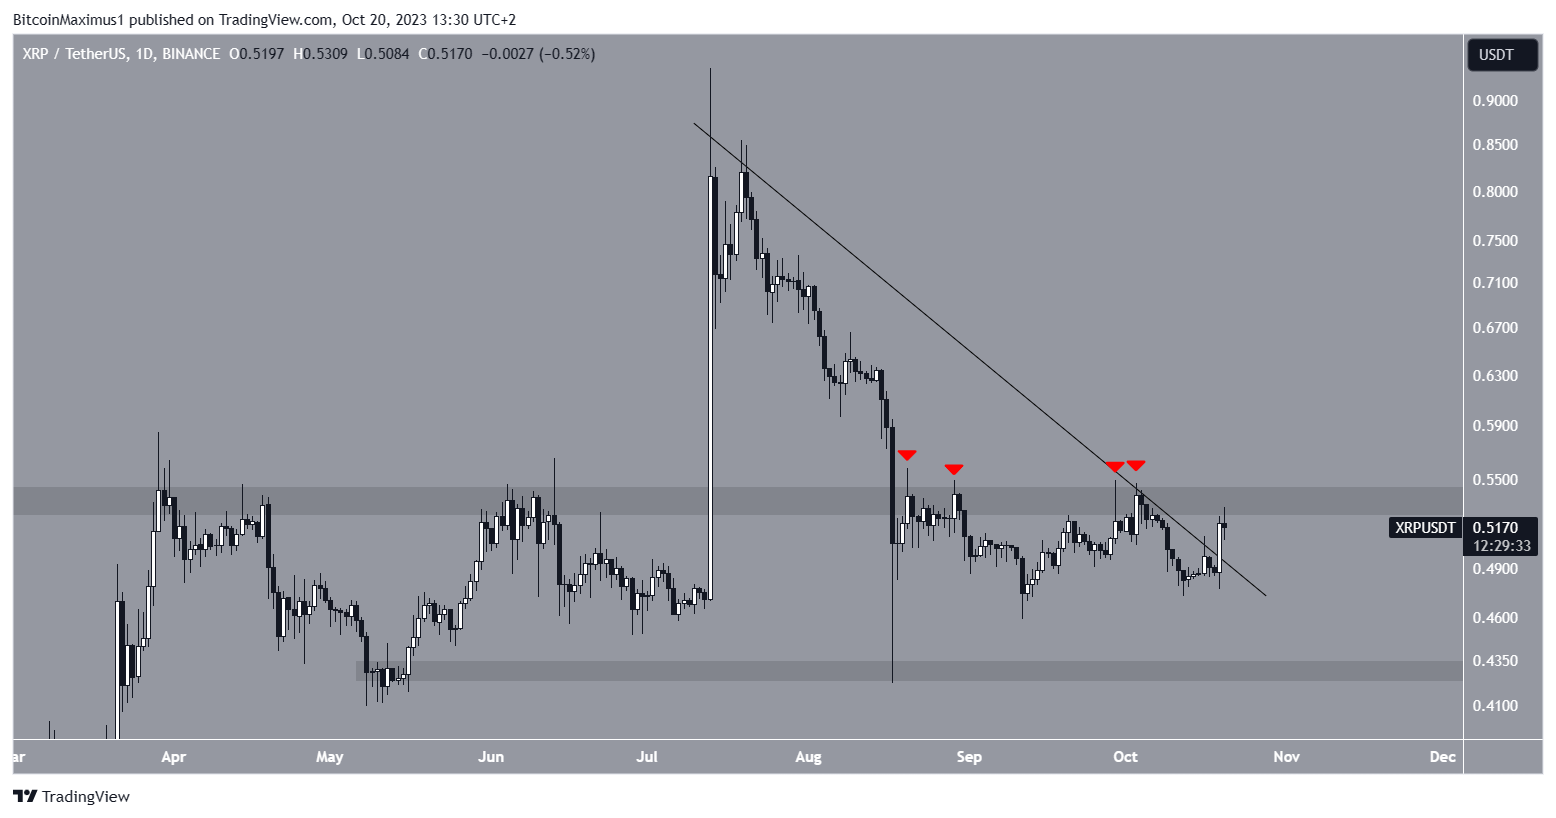
The daily timeframe technical analysis shows that the XRP price has fallen under a descending resistance trendline since its yearly high of $0.94 in July.
The decrease led to a low of $0.42 in August, causing a breakdown from the $0.53 horizontal support area, which now turned to resistance.
After several unsuccessful attempts (red icons) at breaking out from the trendline, XRP finally created a large bullish candlestick and broke out on October 19.
Read More: Best Crypto Sign-Up Bonuses in 2023.
The XRP price still trades below the $0.53 horizontal resistance area despite the breakout.
Recent Ripple Developments Signal Bullish Momentum
Some positive Ripple vs Securities and Exchange Commission (SEC) news hit today’s market. The SEC has dropped its lawsuit against Ripple CEO Brad Garlinghouse and co-founder Chris Lawson.
This comes after a judge denied the SEC’s appeal from a ruling that favored Ripple Labs earlier this year.
This timing is interesting since it follows a recent job opening for the “Shareholders Communication Senior Manager” position, which fueled speculation that Ripple is planning an IPO in the future.
Finally, the Ripple Swell conference is just around the corner, with its main event scheduled for November 8-9. This prominent gathering will feature diverse speakers, including Brad Garlinghouse.
Click here for Ripple-XRP price predictions.
XRP Price Prediction: Will it Reclaim the $0.53 Area?
The shorter-term six-hour timeframe price action and Relative Strength Index (RSI) both support the possibility of an ongoing increase.
The price action shows that XRP has traded inside an ascending triangle since August. The ascending triangle is considered a bullish pattern, leading to breakouts most of the time.
By using the RSI as a momentum indicator, Traders can determine whether a market is overbought or oversold and decide whether to accumulate or sell an asset.
Bulls have an advantage if the RSI reading is above 50 and the trend is upward. But the opposite is true if the reading is below 50.
The RSI is above 50 and increasing, both signs of a bullish trend. Also, it has broken out from its descending resistance trendline (green).
An upward movement that travels the entire pattern’s height will take XRP to $0.70, a 35% increase from the current price.
On-chain data also supports this sentiment. Wallets with 10,000 – 10,000,000 XRP currently hold the highest amount since July 27, while XRP social dominance reached its second highest day in more than a month.
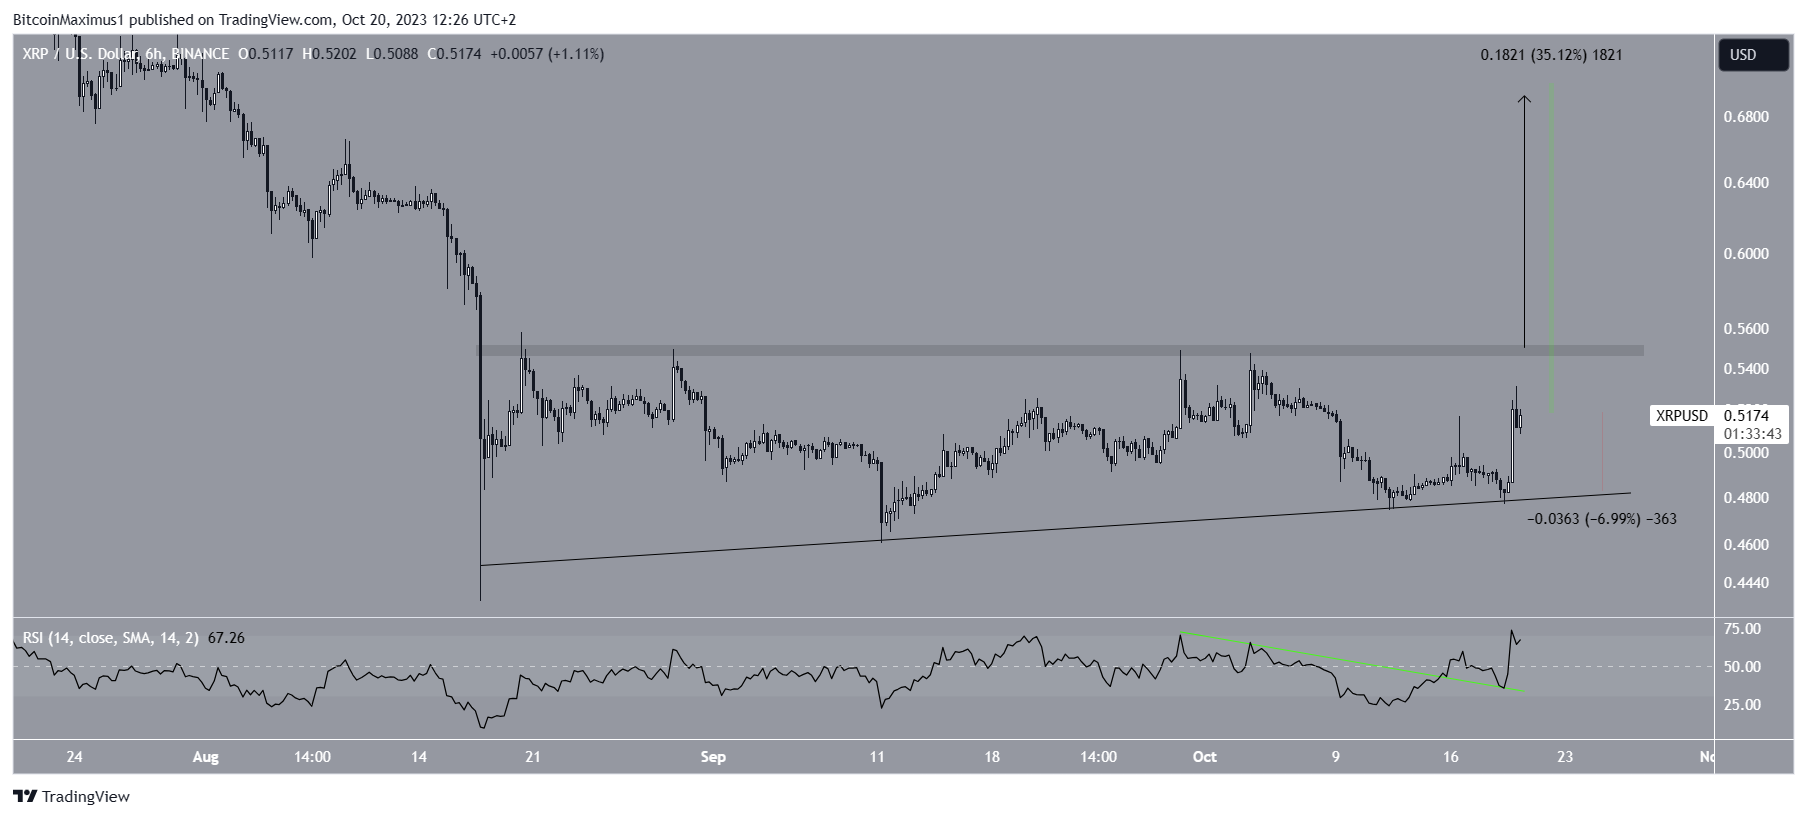
Despite this bullish XRP price prediction, a rejection from the $0.55 area can cause a 7% drop to the long-term ascending support line at $0.49.
Read More: Everything You Need To Know About Ripple vs. SEC
For BeInCrypto’s latest crypto market analysis, click here.