Bears are still dominating, with the global market cap decreasing by 2.2% within the last 24 hours of trade to stand at 1.64T as of press time. This shows bearish sentiment on the market as trading activities dropped by 4% within the same period, indicating a volatile market.
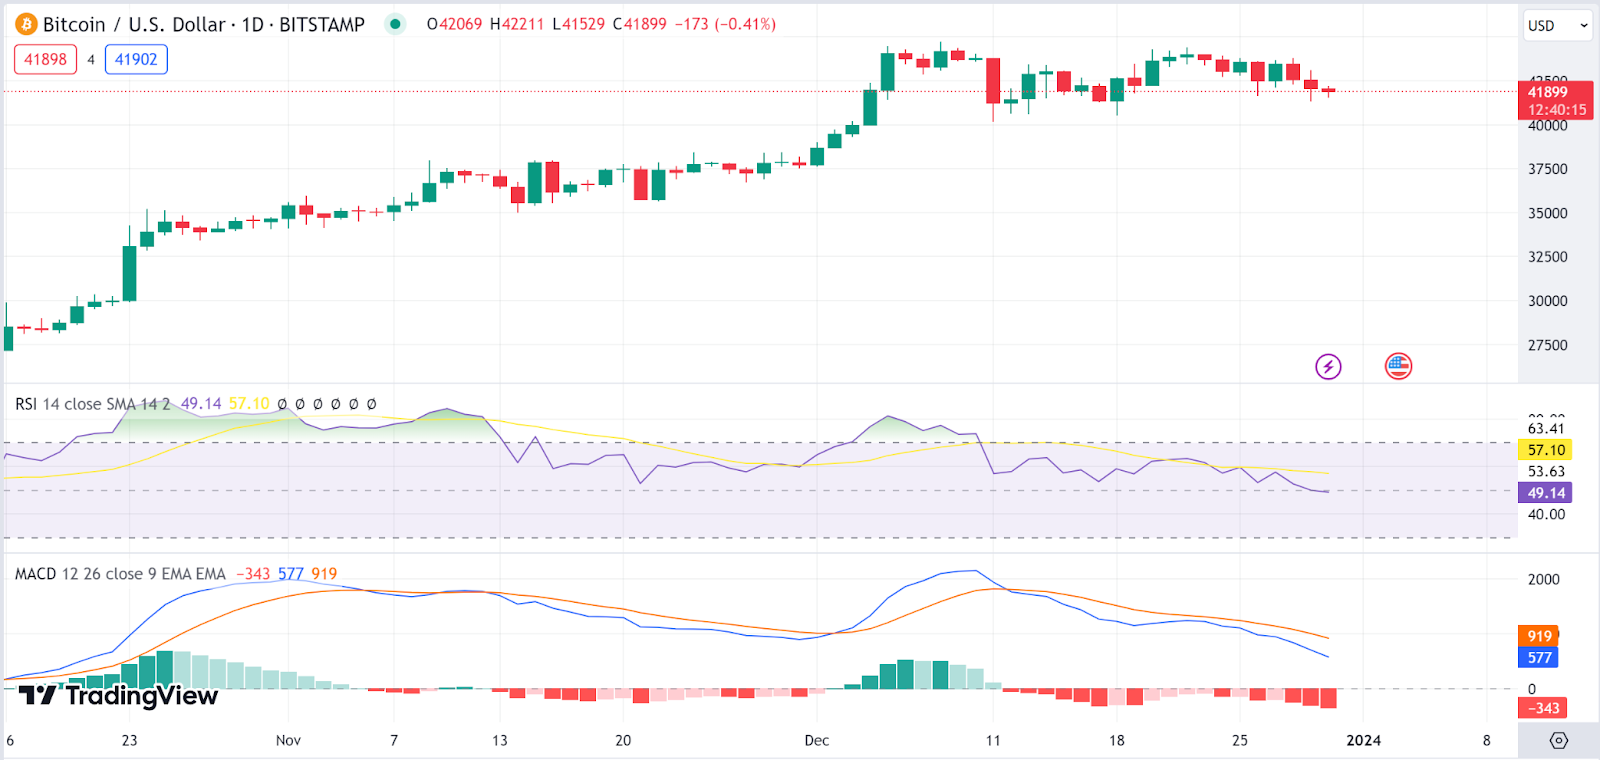
Bitcoin Price Prediction
The Bitcoin price has again failed to post gains as it records a plunge of 2% in the last 24 hours to trade at $41.9K as of press time. This comes as the weekly drop stood at 3.9%. This plunge is likely to continue, as several indicators point out.
The Relative Strength Index indicator is below the average line as it heads south, pointing to a bearish short-term on the Bitcoin price. The MACD indicator is also in the red zone, backing the bullish prospects on Bitcoin.
Ethereum Price Prediction
The Ethereum price is also on bear activity as it recorded a plunge of 0.07% in the last 24 hours to trade at $2,290 as of press time. This comes as the weekly rise stood at 0.2% while the trading volume dropped by 23% in the last 24 hours, as global trading activities increased.
The Relative Strength Index indicator is also headed south as the MACD indicator also moves in the red zone. Both these indicate bear activity on Ethereum as selling pressure mounts.

Kaspa Price Prediction
The Kaspa price has also failed to post gains as it records a plunge of 3.9% in the last 24 hours to trade at $0.1155 as of press time. This comes as it corrects from the recent pump that has seen it trade 6.9% above its previous seven-day price. This plunge is likely to continue, as several indicators point out.
The Relative Strength Index indicator is below the average line as it heads south, pointing to a bearish short-term on the Kaspa price. The Kaspa price is currently facing low volatility, as shown by the Bollinger Bands, which are now converging.

Solana Price Prediction
Solana (SOL) is also facing corrections as the Solana price plunged by 5% in the last 24 hours to trade at $102.3 as of press time. This comes as the Solana corrects from its weekly rise of 7%.
The Relative Strength Index indicator is below the average line as it heads south, pointing to a bearish short-term on the Bitcoin price. The MACD indicator is also in reverting towards the red zone, backing the bullish prospects on Solana.

Tellor Price Prediction
Tellor (TRB) has, however, defied the odds as it recorded a 3% gain within the last 24 hours. This comes as the weekly gain now stood at 46% while the trading volume recorded a 32% plunge within the last 24 hours to stand at $155 million as of press time.
The Relative Strength Index indicator is headed north as it enters the overbought region, showing buying pressure on the token. The MACd indicator is also in the green zone, backing the bullish prospects on the Tellor price.
